A professional 3D gamut viewer allows you to visualize color spaces with absolute precision in three dimensions, solving the limitations of flat graphing.
Standard 2D CIE diagrams only show maximum saturated colors, ignoring the crucial lightness dimension. Using a 3D gamut visualization prevents this by revealing critical flaws in your display's true color volume.
You can't see where gradients block up or highlight details clip in a flat 2D graph.
Assuming a color is reproducible because it falls in a 2D triangle leads to inaccurate edits.
Without knowing your true 3D color volume, soft-proofing becomes a guessing game.
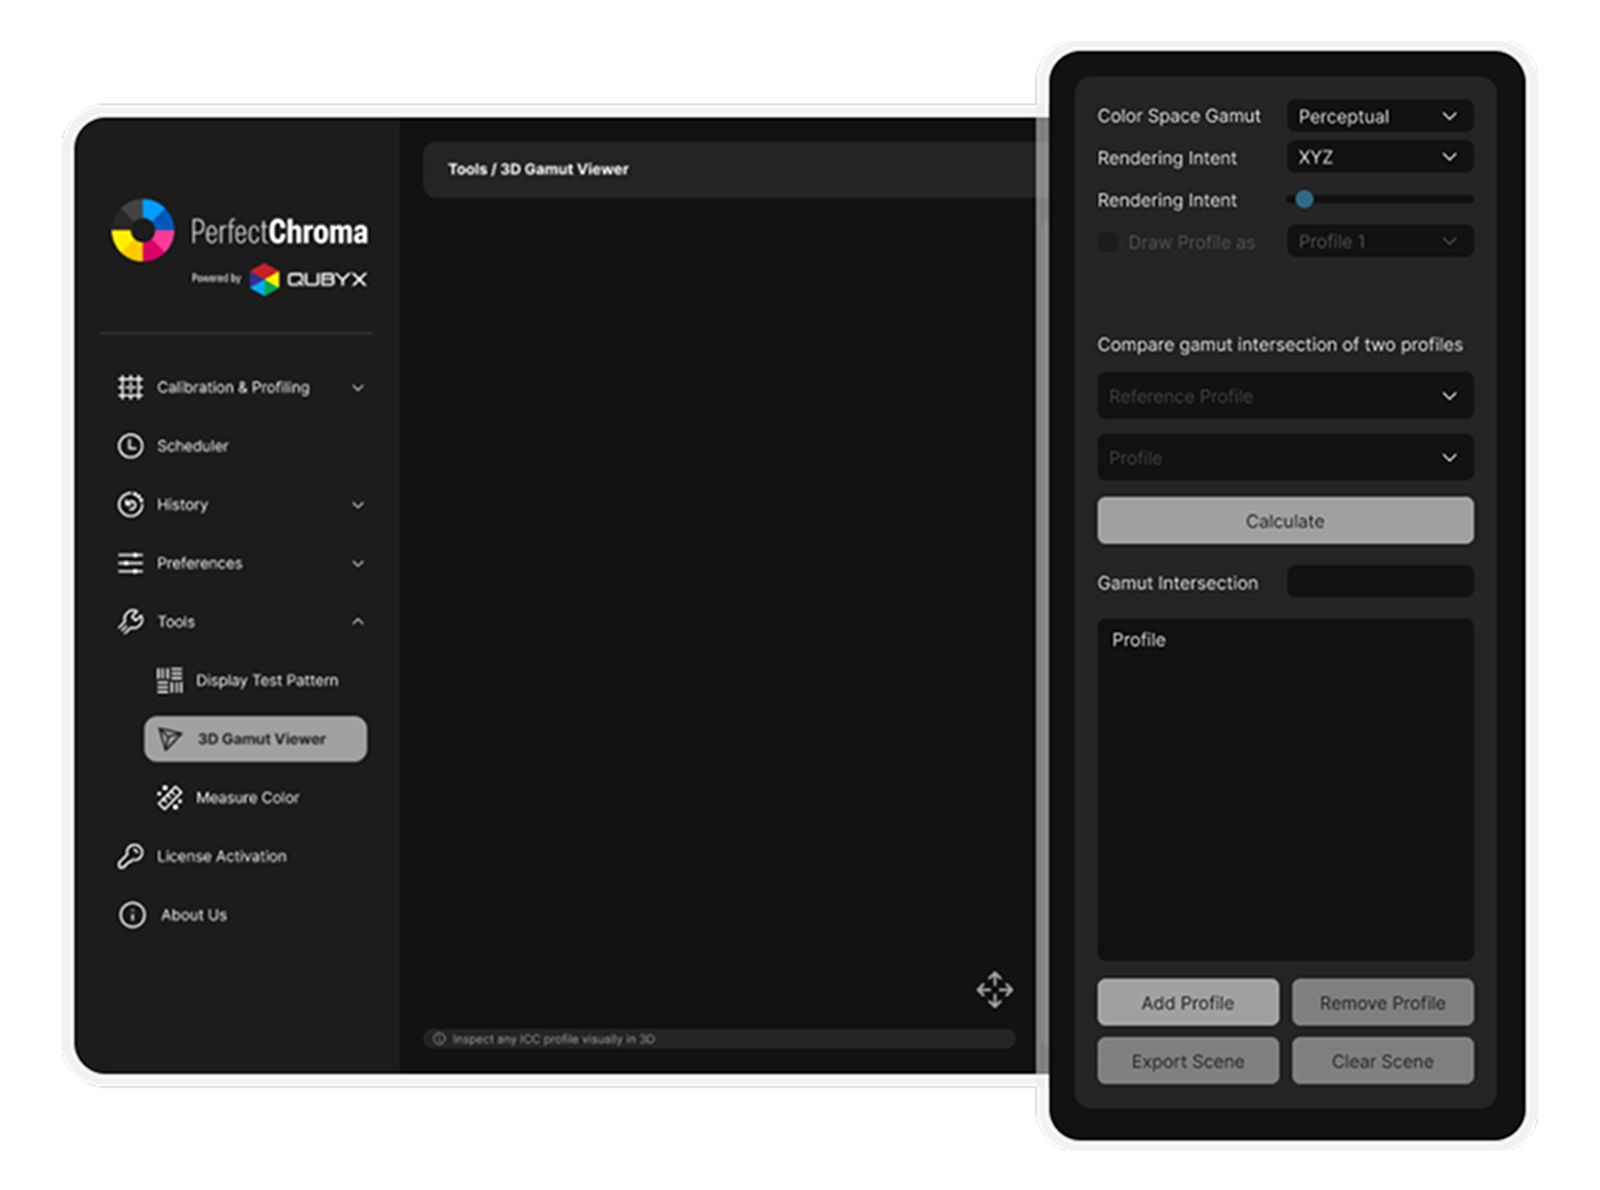
PerfectChroma's built-in 3D gamut viewer maps your display's true capabilities across all lightness levels, giving you an exact 3D wireframe of your color volume.
Actionable insights that directly improve your workflow and output quality.
Know exactly which colors you can safely use without trusting unverified factory claims.
Identify clipping limits immediately, avoiding endless trial and error during color grading.
Export 3D graphs to show clients exactly why colors shift between different mediums.
Track monitor degradation over time by comparing historical 3D volume scans.
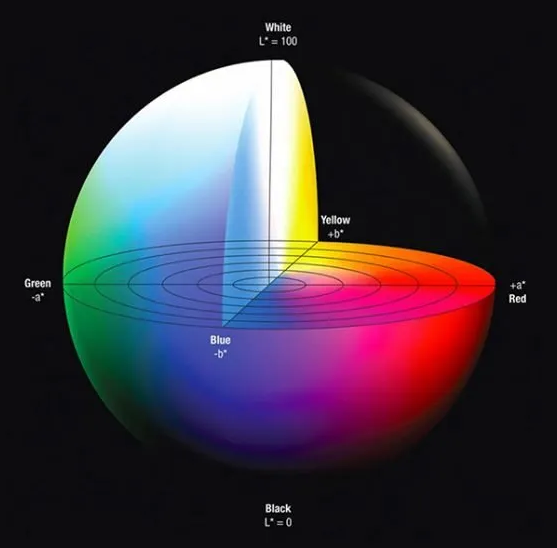
The CIE 1976 L*a*b* (CIELAB) color space is the industry-standard perceptually uniform model used by ICC profiles, print RIPs, and color management modules worldwide. Unlike device-dependent RGB, CIELAB separates lightness (L*) from chromaticity (a*, b*), enabling objective color difference calculations using the ΔE2000 formula.
PerfectChroma's cutting-edge 3D gamut viewer samples your display's ICC profile across hundreds of L* slices (from L*=0 black to L*=100 white), computing the convex hull boundary at each level. The resulting 3D wireframe mesh represents your monitor's exact reproducible color volume — not a simplified 2D projection, but the full three-dimensional shape including the critical dark-tone and highlight regions where most displays silently clip colors.
This volumetric analysis generated by our gamut visualizer reveals issues invisible to traditional 2D CIE xy chromaticity diagrams: shadow gamut compression, highlight desaturation, and hue-dependent volume asymmetry — all critical factors for accurate soft-proofing, HDR grading, and print-to-screen matching workflows.
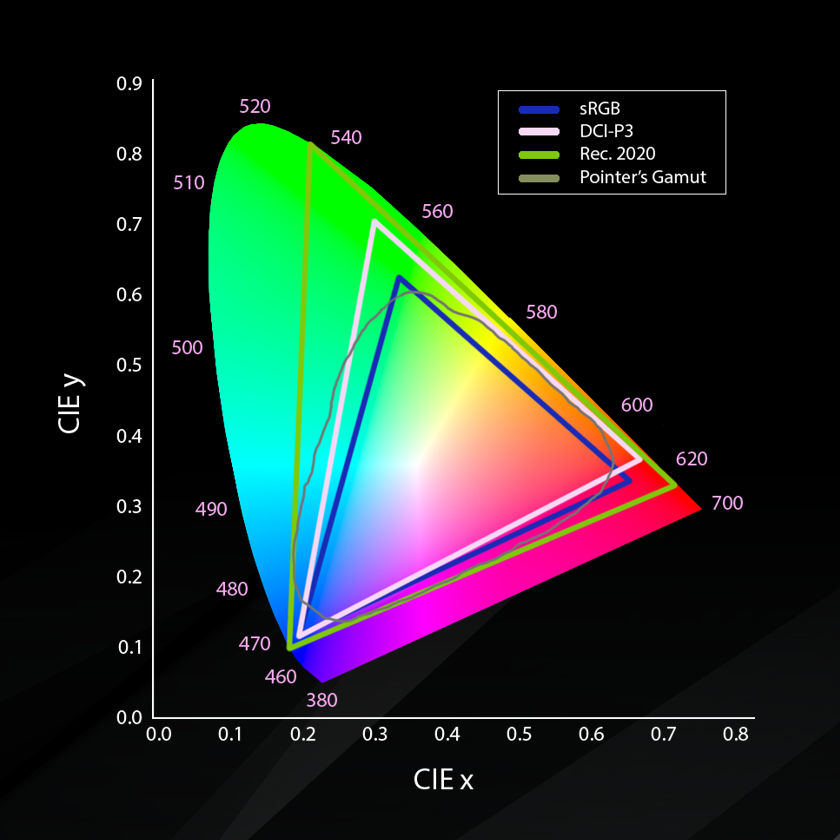
One of the most powerful applications of a 3D gamut viewer is overlay comparison between your display's measured volume and a target output gamut. PerfectChroma allows you to simultaneously render your monitor's 3D profile alongside standard reference volumes such as sRGB (IEC 61966-2-1), Adobe RGB (1998), DCI-P3 (SMPTE RP 431-2), or a custom printer ICC profile.
This instantly reveals out-of-gamut regions — colors your display can show but your printer cannot reproduce (and vice versa). For photographers preparing fine art prints, this eliminates the guesswork of soft-proofing. For colorists working in DCI-P3 on a wide-gamut monitor, the overlay shows exactly which saturated colors will be clipped when the deliverable is viewed on a standard Rec. 709 broadcast display.
The interactive 360° rotation and lightness-level slicing tools let you drill into specific problem areas — such as deep cyan clipping at low luminance levels, or red-orange saturation loss in highlights — enabling precise, targeted color decisions inside the gamut visualization window rather than broad visual approximations.
Everything you need to know about our 3D volumetric analysis tools.
Start examining your true display volumetric capabilities down to the last voxel.