A guide to color attributes, standard observers, chromaticity diagrams, and the device-independent spaces used in color management.
Describing color differences
Colorimetry exists because visual judgments alone are not precise enough for technical work. Two samples may look close, yet still differ enough to matter in reproduction, proofing, or process control. Colorimetry provides a way to describe those differences with stable numerical values.
Color attributes
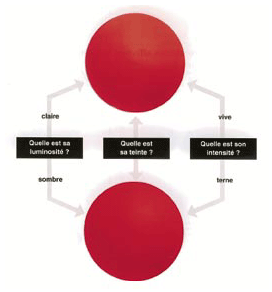
Color is commonly described through three attributes: hue, lightness, and saturation. Hue identifies the family of color, lightness describes how bright or dark it appears, and saturation describes how pure or vivid it is.
Hue
Hue is tied to the dominant wavelength and gives color its familiar name, such as red, green, or blue. It is often visualized around a color wheel.
Lightness
Lightness describes the perceived brightness of a color. It can vary from very dark to very light, and it can be discussed independently from hue.
Saturation
Saturation expresses the chromatic intensity of a color. A strongly saturated color appears vivid, while a desaturated color moves closer to neutral gray.
CIE device-independent systems
Color science moved toward standardized representation through the work of the CIE. These systems were designed to describe color independently of any one scanner, monitor, or printer.
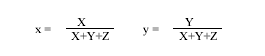
The CIE Yxy color space
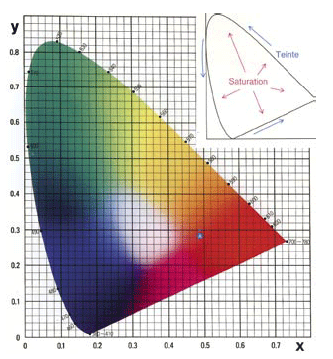
The CIE Yxy system is one of the foundational chromaticity models. It derives from standardized observer data and separates luminance from chromatic coordinates. This made it possible to represent colorimetry in a form that was independent from specific devices.
Other intuitive models such as HSL, HSB, or HSV are useful for interface work, but scientific color management relies on spaces tied to standard observers and measured tristimulus values.
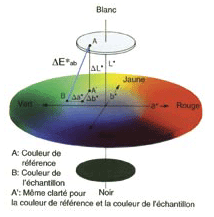
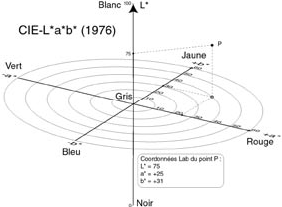
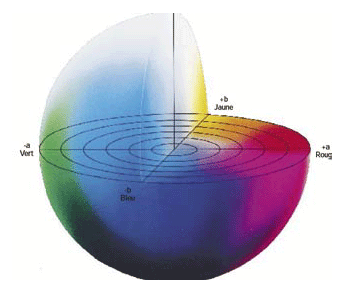
The CIELAB color space
CIELAB was introduced to provide a more perceptually meaningful way to compare colors. In this space, L* represents lightness, a* represents the red-green axis, and b* represents the yellow-blue axis. It is widely used because equal numeric changes roughly correspond to equal perceived changes.
The standard CIELAB relationships are commonly written as:
L* = 116(Y/Yn)1/3 - 16a* = 500[(X/Xn)1/3 - (Y/Yn)1/3]b* = 200[(Y/Yn)1/3 - (Z/Zn)1/3]
Here, X, Y, and Z are the tristimulus values of the sample, while Xn, Yn, and Zn belong to the reference white.
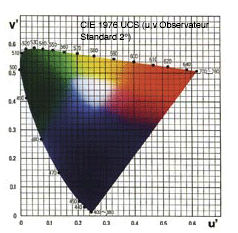
The CIELUV color space
CIELUV was developed for related but somewhat different use cases. Like CIELAB, it is a device-independent model, but it is often discussed in relation to illuminants, chromaticity shifts, and black-body analysis.
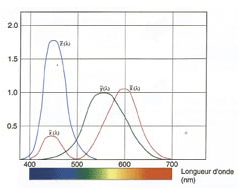
The CIE also defined observer models for different viewing fields, most notably the 2° and 10° standard observers. These account for the fact that color sensitivity changes with the angular size of the observed area.
Color-difference formulas
Once colors are expressed numerically, their difference can be quantified. The most familiar formula is ΔE*ab, which estimates the distance between two colors in CIELAB space.
ΔE*ab = √[(ΔL*)² + (Δa*)² + (Δb*)²]
In production environments, the acceptable ΔE threshold depends on the process, the substrate, and the tolerance defined by the standard in use.
CIE device-dependent systems
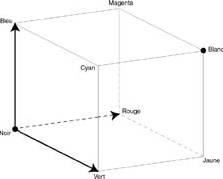
RGB space
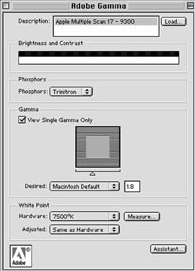
Monitors and scanners work in RGB. It is an additive, device-dependent model, which means its exact color appearance changes according to the hardware and its characterization.
CMYK space
Printing systems work in CMYK, a subtractive and highly device-dependent space. Ink set, paper, screening, press condition, and process control all affect the final result.
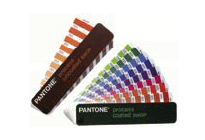
Color libraries and charts
Reference libraries such as Pantone systems help designers and printers communicate target colors. They remain useful, but they must always be interpreted within the context of the actual print condition and substrate.